We love learning about how new businesses bring something different to their category. Take Lara Merriken’s story of creating Larabar on How I Built This.
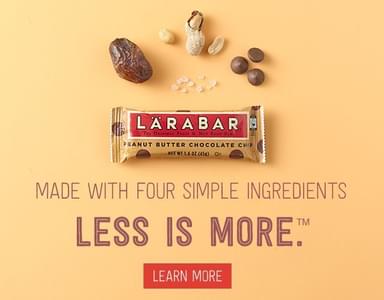
Having recently divorced in 2000, Lara spent most of her time at home and that’s when the idea of creating a healthy energy bar came to mind. She wanted to create a bar with the fewest and simplest ingredients possible, making it a healthier snacking option for children and adults.
“Better-for-you” snacking is on the rise across a variety of sectors: another recent study we did on potato chip packaging claims is proof of that. And brands like Larabar create certain standards for the kinds of claims and messages that the perfect nutritious bar should hit to capture demand.
But there are just so many things you can say about energy bars, not everything can fit on a small rectangular piece of space. Which ones do you prioritize and which ones will drive the most sales?
We’ve decided to put some ideas to a test. Using Upsiide’s Claims Assess Template, we run a study with a total of 800 people in the US and the UK. In that study, we asked respondents to answer a few energy bar consumption questions, go through an idea screening exercise, and answer some extra questions about some of the ideas.
Our audience setup:
Base size: 800
USA, UK
18-80 years old
50% male, 50% female
Have consumed energy bars in the last 3 months
Here’s a little explanation of Upsiide’s scores. We measure the results based on Interest Score, Commitment Score and Idea Score. The Interest Score is the proportion of people who liked an idea. When respondents like two ideas, they are asked to trade-off between them, picking a favourite - which generates the Commitment Score. Finally, the Idea Score is based on a combination of the Interest Score and the Commitment Score - it's an absolute score that's been calibrated to predict the performance in-market.
Let’s take a bite out of the results.
6 Key Insights About Optimizing Energy Bar On-pack Claims
1. Consumers value energy bars for convenience and accessibility, the energy boost, and taste
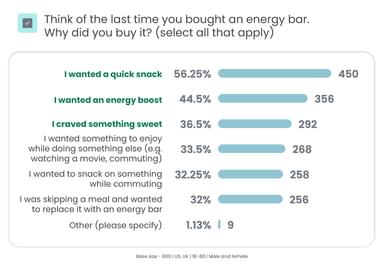
Respondents have a variety of reasons for buying an energy bar. The top three contain “I wanted a quick snack” (56%), “I wanted an energy boost” (44.5%), and “I craved something sweet” (36.5%). It’s interesting to see that “wanting a quick snack” came ahead of “wanting an energy boost”, considering that “an energy bar” would usually be associated with giving you the energy to help you get through the day.
If we filter the results by the audience, we see some changes in the US audience. While “I wanted a quick snack” and “I wanted an energy boost” stayed in the same priority order, “I was skipping a meal and wanted to replace it with an energy bar” comes third with just over 40% choosing that reason along with others.
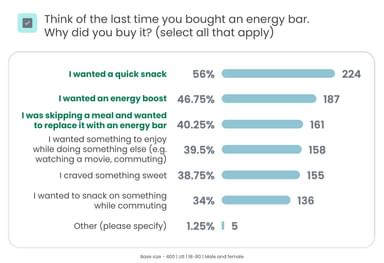
This result shows that energy bar brands that want to tap into the US market should consider adding some on-pack claims about the bar being a good meal replacement option. A good example of a brand that embraces this idea is Huel. After producing meal replacements in powder form, the company started producing nutritious energy bars that contain all the necessary vitamins and ingredients for those of us that are on-the go and need to skip a meal once in a while.
2. Americans look for information about ingredients, whereas Brits are more focused on value for money
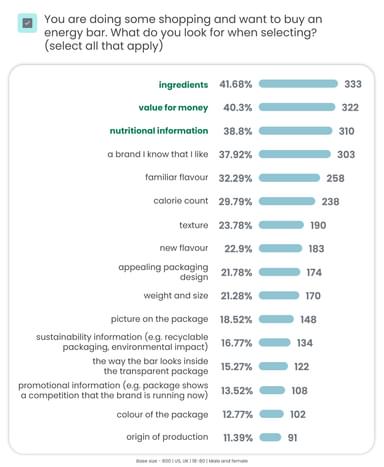
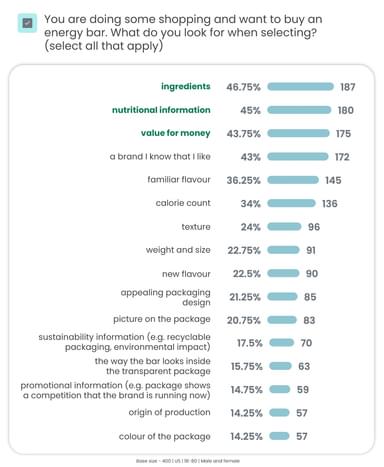
In general, the top 3 things that people look for on energy bar packaging are ingredients (42%), value for money (40%), and nutritional information (39%). Compared to the chips category, in which consumers care more about a brand and flavour, people who buy energy bars are more invested in knowing what’s inside the product and the utility derived from the purchase.
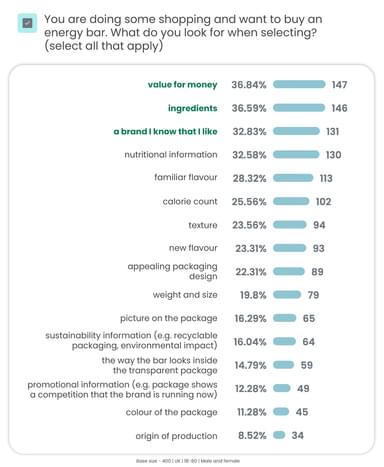
The results get more compelling when we look at US and UK audience groups separately. In the UK, people seem to care more about “value for money” (37%), “ingredients” (37%), and “a brand I know that I like” (33%). 2 out of 3 claims seem to indicate an emotional response to an energy bar: “value for money” is more of a perceptive feeling about a purchase whereas “a brand I know that I like” indicates a positive reaction.
In the US, however, things look a little different. “Ingredients” (47%), “nutritional information” (45%), and “value for money” (44%) are the most important things that Americans look for on a package. This audience is more interested in seeing factual and technical information like ingredients and nutritional info.
These results show that energy bar brands should always think of where their target audience is to prioritize different claims on a package. If you are serving the UK market, your packaging should stimulate an emotional response or create brand differentiation. Whereas if you’re targeting the US, get your product information and facts front and center.
3. “Made with real ingredients” is the most universally appealing claim on energy bar packaging
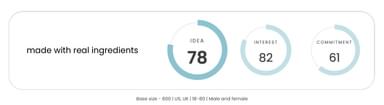
So which on-pack claim performed best? “Made with real ingredients” was a winner in this race. The claim came first by Idea Score (78) and appeared in the Winners quadrant in the quadrant chart.
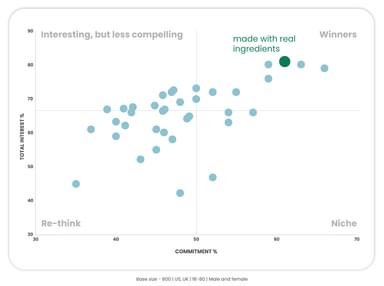
The quadrant chart categorizes the claims into four brackets, according to the balance between their ‘Total Interest’ - how many people swiped right - and their Commitment Score - how often they chose a specific claim when pitted against another claim that they liked. Being a Winner in the chart means that the claim performs well when it comes to interest and commitment - i.e. the perfect claim to put on your package.
We also tested “made with real ingredients” in our Idea Split exercise. The exercise helped us get a deeper understanding of how people react to each claim and what they think about them. 82% of respondents said that they would ‘definitely buy’ and ‘probably buy’ an energy bar if it has “made with real ingredients” on the package. This result proves the commercial potential of the claim.
Finally, to see how successful “made with real ingredients” is in combination with other claims, we used our in-house TURF (Total Unduplicated Reach and Frequency) modelling tool. The goal of TURF is to show the percentage of consumers that a claim can potentially reach and identify the combination of claims that reach the most potential customers.
TURF showed us that “made with real ingredients” has the most potential to boost sales if it is paired with “natural ingredients”. This result is applicable across all age groups.
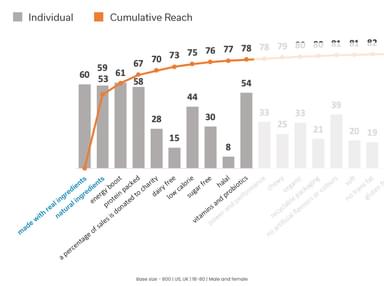
All this data suggests that “made with real ingredients” is a universally appealing claim that has the most potential for success. If a brand is looking for a claim to focus its product around, “made with real ingredients” is the foundational claim to start with.
4. People are more attracted to claims that connote the sensation of eating something healthy
We wanted to understand how the tested claims clustered together and how they connected. The Idea Map was the perfect tool for that purpose.
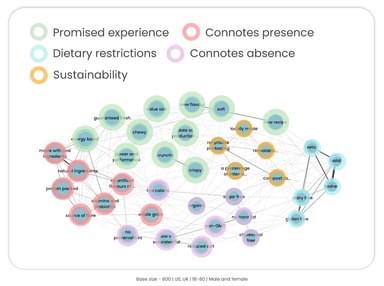
After reviewing where ideas appeared on the Idea Map, we outlined a few groups that share similarities. We named them:
Connotes presence - claims that verbally reference the presence of certain ingredients or micronutrients.
Connotes absence - claims that verbally reference the absence of certain ingredients or micronutrients.
Promised experience - claims that verbally reference the experience that an energy bar brand guarantees.
Sustainability - claims that verbally reference environmental benefits.
Dietary restrictions - claims that verbally reference health- and religion-related dietary regulations.
Curiously, the group that liked claims that connote the presence of ingredients or micronutrients performed much better than the one that connotes the absence of those. We often see energy bar brands use claims with a negation like “low fat” and “sugar-free” on the packaging, but it appears that people are more attracted to claims that signify the positive and experience of eating something healthy (e.g. “protein-packed” and “vitamins and probiotics”).
It’s also worth noting how differently people choose claims they like, depending on the category. In the chips study, claims like “crispy” and “crunchy” suggest the ideal eating experience performed the best, meaning that consumers of chips care about the textural aspects of the product. In the energy bar study, however, these same claims didn’t make the cut (they aren’t even in the top 10!), which suggests that shoppers don’t buy energy bars for their texture. They buy energy bars because they want to consume something that contains healthy ingredients.
5. Protein and ingredients were the most recalled claims, but there are some exceptions
It’s one thing to know which claims people like and don’t like, but a whole other to see which ones people remember. We asked respondents to tell us all the claims they remembered after doing the Idea Screen exercise and the results surprised us.
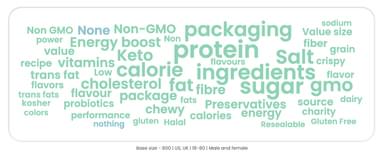
The word cloud above shows that “protein”, “sugar” and “calorie” are remembered most, meaning that they were mentioned the most in the responses. This means that they were the most memorable claims and can be recognized by shoppers.
What surprised us was the appearance of responses containing “salt” (specifically, “low salt”), even though this claim wasn’t tested in the Idea Screen. Perhaps those respondents associated “low salt” with other claims that connote the absence of something like “low calorie” or “low in saturated fat”. This could mean that consumers are so used to seeing these kinds of on-pack claims that they’ve become synonymous with all food packaging, meaning that brands need to tap into other claims to attract attention.
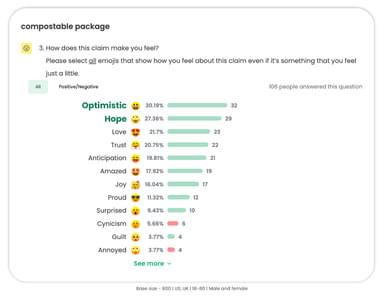
6. “A compostable package” could be the next new thing, but it doesn’t shift consumer choice
The Idea Split section showed us how ideas perform in isolation and how consumers react to the claims in isolation.
All claims performed differently but “compostable package” performed in an interesting way. When we asked people to identify emojis that they associate with the claim, 30% chose “optimistic” and 27% chose “hope”.
“Compostable package” got the highest scores in these categories: “different vs what’s available now” (87%), “better than what’s available” (81%), “worth paying more for” (74%), “would be a new experience” (80%), and “worth sharing with a friend or on social media” (78%). These categories share something in common: they all imply that the claim is innovative and has a lot of potential in the future.
But before a brand starts investing in compostable packages, we should warn that “compostable package” might not be the priority for everyone when it comes to purchase intent. While people react positively to the claim, in comparison to other claims, “compostable package” isn’t particularly impactful when it comes to purchasing decisions. Only 29% of respondents say that they would definitely buy an energy bar that’s wrapped in a compostable package; to compare, “made with real ingredients” would prompt 46% of shoppers to purchase.
These results show that even though people care about the environmental benefits of making energy bar packaging compostable, it is not a deal-breaker or a reason to convert. They would rather pay for an energy bar that is “made with real ingredients”.
To sum up
This study shed more light on how consumers react to different on-pack claims depending on the snacking category. If you want to learn how to optimize claims in the chips space, we’d love to show you the other study we did with US and UK consumers. Follow the link below to view the results.