They’re crunchy, they’re crispy, they’re ever so tasty. Potato chips are probably one of those foods that you can eat a whole bowl of and you’ll still crave more. It’s the reason that Lay’s slogan has been “bet you can’t eat just one” for the last decade.
The Super Bowl is one of the biggest events, and it triggers such a wide consumption of snacks, chips being the most-consumed one. A whopping 11.2 million pounds of chips are consumed by Americans every year during the Super Bowl.
(Before you fall off your chair after looking at that stat, you should also know that Americans eat 1.3 billion (!) pounds of chicken wings on Super Bowl Sunday. But that’s a story for another day.)
And chips/crisps aren’t just a US phenomenon; 93% of the British population eat crisps regularly, whereas 63% admit that they snack on crisps every day. One older yet still shocking stat from 2010 also reveals that annually Britain consumes around 6bn packets of crisps, and that’s not counting another 4.4bn bags of other assorted savoury snacks).
Over the last ten years, the chips category has been disrupted by ‘better for you’ snack brands. And for good reason; health-conscious consumers are increasingly looking for better alternatives to classic chips, swapping their favourites with lower-fat and lower-calorie options.
A whole lot of new products have been introduced to the market. You might recall seeing packs of zero-calorie chips, rice chips, vegetable chips, chips boasting low salt, low fat, low cholesterol... low everything that’s not so good for your body.
And so we started to wonder, what’s the proverbial ‘sweet spot’ for chip claims and messaging? What kinds of health-related claims make consumers reach for a bag on shelf and think, “Yes, these are for me”? What actually defines “a good chip/crisp” and is that definition different for various audience groups? And finally, do health claims on chips/crisps packaging actually prompt people to buy, or is brand far more important?
We found answers to all of these questions and more in our brand new study of claims that appear on chips/crisps packaging. And since the US and the UK are such big markets for chips/crisps consumption, we focused on those countries.
Our study consisted of a few consumption questions, followed by an idea screen in which we asked respondents to imagine seeing a claim on the bag of chips and tell us which one motivated them most to buy it. Finally, respondents answered several questions about 8 of our chosen claims and told us why they would or wouldn’t buy those chips.
Here’s our audience breakdown:
Base size: 600
USA, UK
18-80 years old
50% male, 50% female
Have consumed chips/crisps in the last 3 months
Before we start crunching up the data, here’s a little explanation of Upsiide’s scores. We measure the results based on Interest Score, Commitment Score and Idea Score. The Interest Score is the proportion of people who liked an idea. When respondents like two ideas, they are asked to trade-off between them, picking a favourite - which generates the Commitment Score. Finally, the Idea Score is based on a combination of the Interest Score and the Commitment Score - it's an absolute score that's been calibrated to predict the performance in-market.
Now, go get your favourite snack and look at the results.
Let’s set the scene…
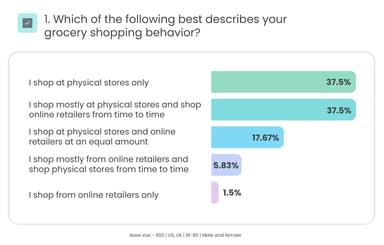
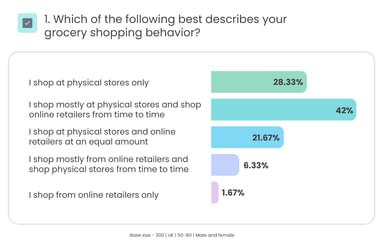
62% of US and UK consumers shop online for at least some of their groceries
This result was surprising to us because the amount of occasional online shoppers was higher than those who shop exclusively in physical stores. 38% indicated that they shop exclusively at physical stores, and the same amount of consumers go to both physical and online stores from time to time for grocery shopping. The fact that another 25% said that they shop at online stores more frequently suggests that consumers have become more flexible with where they get their groceries from.
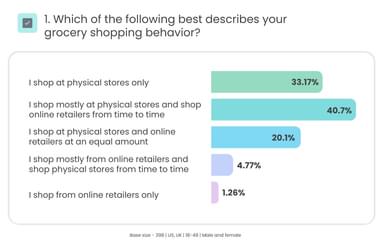
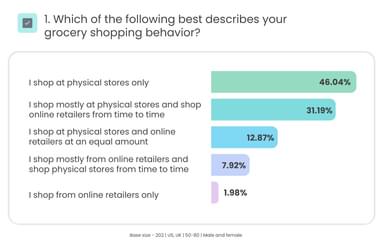
The results, however, look a little different when we filter by age. 18-49-year-olds are more skewed towards both physical and online shopping. 41% indicated they shop online from time to time. Meanwhile, people over 50 tend to shop exclusively at physical stores (46%), though over 22% also like shopping at online stores for some of their groceries.
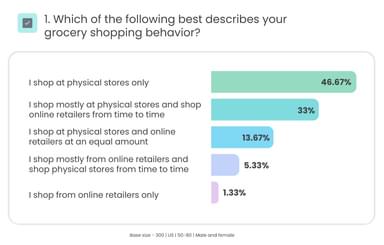
A similar trend is visible if we compare both countries. The majority of people in the US shop at physical stores only (46%), whereas most UK people shop at physical stores and online stores from time to time (42%).
There could be many reasons for why this is the case. Maybe UK consumers tend to find a greater selection of groceries they need if they shop online. Maybe the amount of large physical stores is just higher in the US and people are more comfortable with shopping there. It could be that the online shopping experience at large grocery stores in the UK is simply better than in the US. Whatever the reason is, the differences between countries are evident, therefore chips/crisps brands that want to tap into those markets should consider how people shop for their groceries.
6 key insights that matter for snack brands
1. US consumers care most about the brand while UK consumers care most about flavour
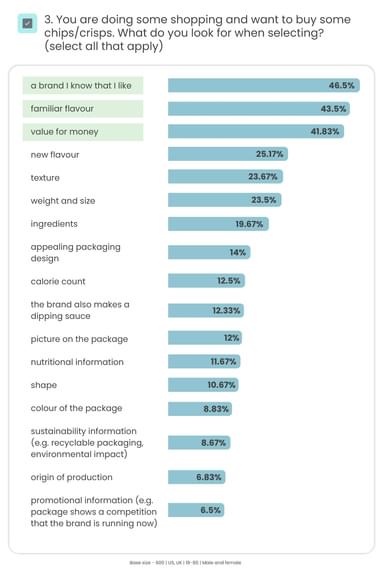
We asked consumers what they look for on packaging when they go shopping for some chips/crisps. We found that people’s choices differed depending on where they live. In general, the most popular things were “a brand I know that I like” (46%), “familiar flavour” (43%) and “value for money” (42%).
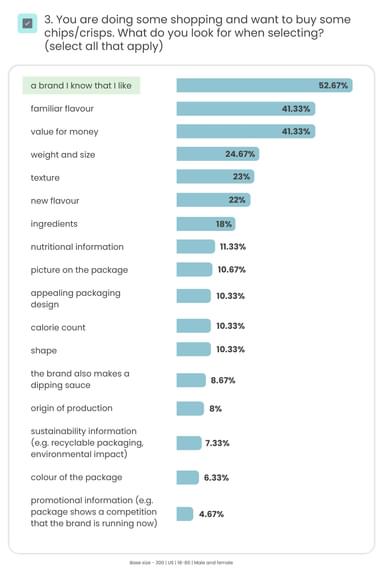
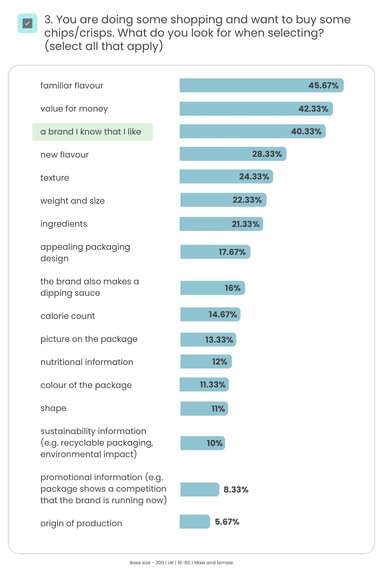
If we filter the results by country again, those top three packaging elements start moving around. “A brand I know that I like” takes the lead among the US audience (53%), followed by “familiar flavour” (41%) and “value for money” (41%). However, things change when we look at the UK audience; “A brand I know that I like” moves to third place (40%), while “familiar flavour” moves up to the top (46%), followed by “value for money” (42%).
It seems like the role of a brand on a chips/crisps package changes depending on the country. It could be a case that US chips brands have established slightly stronger associations that drive purchase intent. Another question is brand differentiation: maybe people in the UK find it hard to spot important points of differentiation between various brands, so they prefer looking at flavour and value for money when they shop for crisps.
2. The chips/crisps category claims can be divided into 5 distinct categories
We tested lots of different claims and found a few patterns in the data. We used the Idea Map view in Upsiide to find those connections between certain claims and were able to divide the space into 5 different groups:
Eating Experience Claims - claims that verbally reference the experience of eating chips/crisps
Health Claims - claims that verbally reference wholesomeness and nutrition benefits
Flavour and Cooking Method Claims - claims that verbally reference the way the chips taste or are cooked
Dietary Restrictions Claims - claims that verbally reference chips for those that follow some sort of diet due to health or religion-related reasons
Packaging Claims - claims that verbally reference the way the chips are packaged
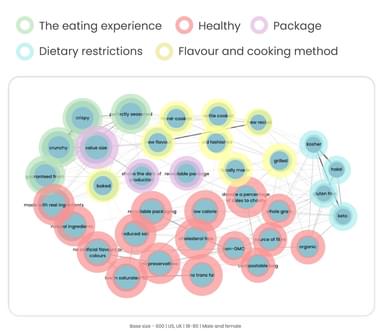
The claims in the “Eating Experience” category performed much better than those in other categories, with an average Idea Score of 72. In contrast, the claims in the “Dietary Restrictions” category didn’t perform that well: “keto” (Idea Score of 40), “kosher” (37) and “halal”(34) are the least popular claims in the category.
The “Health” claims category is the biggest and contains claims related to nutritional value, ingredients and sustainability. Claims about sustainability such as “compostable bag” and “donate a percentage of sales to charity” do not cluster together but are instead combined with those related to health. This implies that in the chip/crisps space these claims do not define a distinct consumer segment.
This division of categories can help brands in the category navigate through the underlying systems at play in the space. Those brands can either draw from the claims within these defined categories to fit into the market or completely disrupt the categories to differentiate themselves or attract the attention of a niche audience group.
3. The top-performing claims are related to taste and perceived health
The Idea Screen exercise revealed some interesting patterns. The most popular claims by Idea Score include “crispy” (75) and “crunchy” (73). What unites these ideas is that they both describe the texture of the chips/crisps. This highlights that consumers like claims that denote the pleasures of the chips/crisps experience.
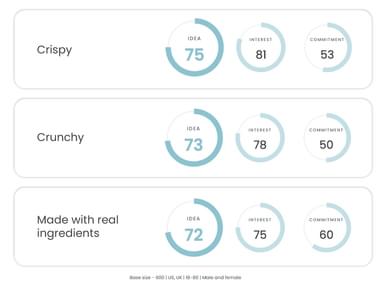
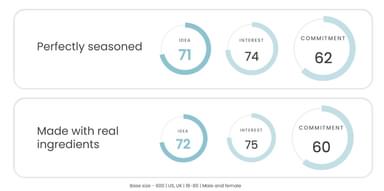
The third claim that made the list by Idea Score is “made with real ingredients”. This claim also appears to be the second top idea by Commitment Score, along with “perfectly seasoned” (a claim related to taste) that came in first place. Here again, we see that a claim related to taste is accompanied by a claim related to health. Their positions indicate that, while these claims may not be the most popular, they are compelling to a smaller cohort of consumers, demonstrating a potential opportunity for product differentiation.
The quadrant chart categorizes the claims into four brackets, according to the balance between their ‘Total Interest’ - how many people swiped right - and their Commitment Score - how often they chose a specific claim when pitted against another claim that they liked.
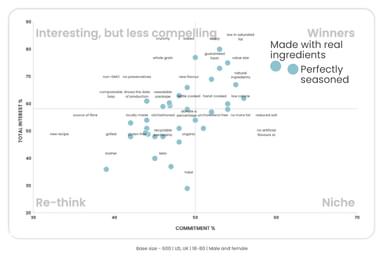
You can see that even though “crunchy” and “crispy” won out in Idea Score, it is “perfectly seasoned” and “made with real ingredients” that sit squarely in the Winner quadrant. Claims within this quadrant are popular both by total interest and by commitment. It’s interesting to see that both taste and health-related claims equally performed well, which means that brands shouldn’t forget about including both types of claims within their on-pack messaging.
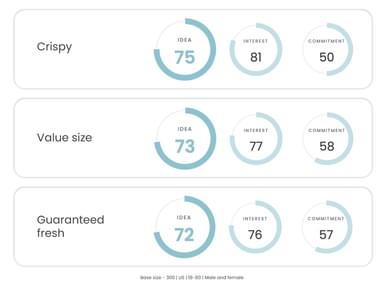
4. Americans value freshness and size, whereas Brits value taste
Despite the popularity of health and taste-related claims, it’s also worth mentioning that where someone lives has a huge impact on which on-pack claims drive consumers to buy.
The top-performing claims for chips/crisps among the US audience are “crispy” (Idea Score of 75), “value size” (73) and “guaranteed fresh” (72). In contrast, the UK audience chose “crispy” (75), “perfectly seasoned” (75) and “crunchy” (74) as its top choices.
Top-performing claims among the US audience
Top-performing claims among the UK audience
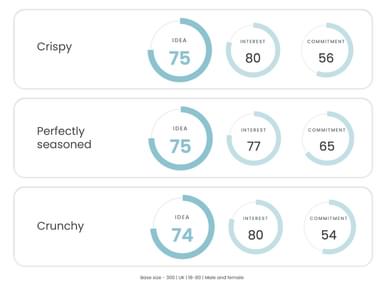
We see a pattern here: the US consumers seem to be primarily interested in the freshness of the product and the size of the package, whereas the British consumers like claims that describe the ideal chips/crisps experience. This means that if brands want to optimize their on-pack claims for the market, they should focus on size and freshness in the US and texture in the UK.
5. Age has a strong impact on preference when it comes to on-pack claims
To learn how people of different ages react to the claims, we turned to the TURF (Total Unduplicated Reach and Frequency) modelling tool built out by the analytics team at Dig Insights. The goal of TURF is to show the percentage of consumers that a claim (in this case, chips/crisps) can potentially reach and identify the combination of claims that reach the most customers.
We wanted to learn which 2 claims are likely to attract the highest percentage of consumers, comparing and contrasting across age groups.
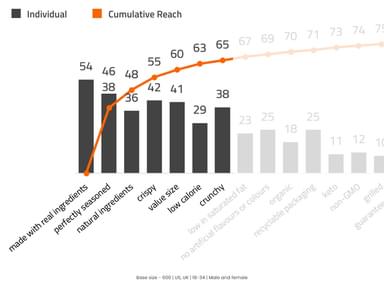
If we look at 18-34-year-olds, we notice that the claims “made with real ingredients” and “perfectly seasoned” would reach 38% of chip-eating consumers. The younger audience group is attracted to claims related to health and texture.
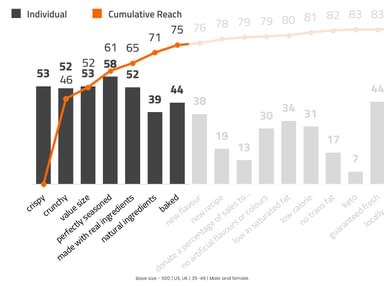
46% of people aged 35-49 are reached by claims “crispy” and “crunchy”, meaning that this group is particularly interested in claims that describe the texture of chips/crisps.
Finally, over half of those over 50 years old can be reached by claims “made with real ingredients” and “value size”. This highlights that the older generation is interested in chips that are a little healthier and come in bigger sizes.
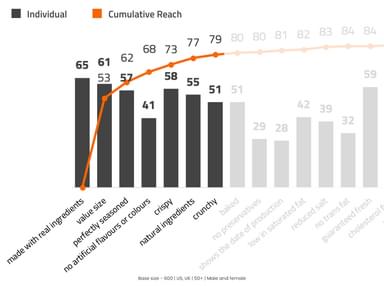
TURF shows that different generations have different motivations when they buy a bag of chips. While some are interested purely in the eating experience, others want healthier options and good value for money. Therefore, if chips/crisps brands want to go after a particular age group, they should use these claims for their respective packaging.
6. People want simple claims, and they’re tired of the word ‘organic’
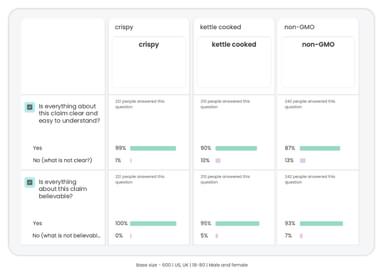
We tested 8 claims in the Idea Split exercise to learn what people think of each one of them separately. We asked them which one they think is the clearest and most believable, how often they would eat chips/crisps if they saw that claim on a bag and what their emotional reaction is to these claims.
As a rule of thumb, 85%+ is a good score if you’re testing claims on believability and clarity. Most of the claims did well in this case. “Crispy” was a winner. The claim was considered the clearest (99%) and most believable (100%). “Kettle cooked” and “Non-GMO” fall short of this on clarity; they earned 90% and 87% respectively.
“Crispy” did well in the emotional reaction test, too: when we asked consumers to tell us which emojis they associate with this claim, the majority chose positive emojis like “trust” (15%), “hope” (18%) and “optimistic” (24%).
In contrast, a claim that we expected to perform well didn’t live up to our hypothesis. “Organic” got the most negative emojis, including “cynicism” (12%) and “disapproval” (9%).
We dove deeper into open-end responses to learn why people reacted this way and found that the majority are simply tired of seeing the “organic” label on consumer packaged goods (CPG) products. Some of the sentiment mentioned that the claim lost its value (“It makes no difference if something is labelled organic if it really isn't”). Others said that organic often means “expensive” (“The organic claim will put the chips out of my price range.”). But generally, there was just a sense of skepticism towards the claim because consumers have seen companies use it everywhere, even if it’s not true (“term is USED WAY TOO often”).
These results show that shoppers today can sense when something is a bit fishy, especially when a brand puts a claim on-pack without much proof. Consumers do want to be healthy, but they want brands to step up and show transparency too.
That’s probably why simple claims like “crispy” win consumers over so easily - claims like this are direct and speak to the very thing that one could expect from a bag of chips/crisps. As one of the UK respondents said, “Love crispy crisps”.
Writing a persuasive on-pack claim is hard…
…but this study shows how much people value seeing a claim or a message that resonates with their lifestyle and preferences. We are going to be making more studies about our favourite snacks soon. Why not get acquainted with Upsiide to see our work for yourself? Book a demo with our team now and stay tuned for more delicious content!