
The economic realities of the “new normal”
The pandemic, along with many other political realities, means that our economy is particularly unstable at the moment.
Prices for gas, energy and food are soaring. The Russian invasion of Ukraine might also lead to supply shortages, which, again, means higher prices for goods. And the culmination of it all has been the inflation rate hitting a 40-year high of 8.5% in the US and 6.7% in Canada in March 2022. And there’s clear evidence that consumers are feeling the impact of all this, some more than others.
As the indexes for gasoline and energy have increased by 18.3% and 1.0% respectively, people are slowly incorporating new habits of saving money. Some are trying to drive less, while others are reconsidering their vacation plans to prioritize essential expenses like food.
With all these things in mind, we wanted to better understand how inflation has affected people’s shopping behaviors. Specifically, we looked at the impact of inflation on different product categories to get a sense of where trade-offs were being made and why.
A few details about the study
The study was done in collaboration with our parent company, Dig Insights. Research pros at Dig conducted an online survey with over 3,000 Canadians and Americans over 18 years old.
In this blog post, we’re going to cover the results of one part of that mega report (which can be found here) where we leverage Upsiide’s Idea screening methodology. Here’s how idea screening works on Upsiide: respondents see each ‘idea’ or piece of stimulus one at a time and swipe right or left, indicating their interest (left) or disinterest (right). Once they’ve swiped left or ‘liked’ two ideas, those ideas enter a trade-off; the respondent is required to select which idea they like more. This allows us to understand commitment. This approach allows us to gather an Interest score, Commitment score, and Idea Score - an absolute score that is calibrated to predict the success of an idea in-market.
For this article, we focus solely on findings in the US market. But if you want to learn what else we discovered about Canadian and US shoppers, our Dig Insights team also created 2 comprehensive reports which cover both countries. Download them by clicking the buttons below.
Here are some notes about our total sample:
Total base size: 3,086
Canada (n=1555), USA (n=1531)
Adults aged 18+
Male and female
5 ways inflation has impacted shopping behavior
1. Americans who have had to change their buying habits for one fresh food item have largely changed their buying habits for most fresh food items.
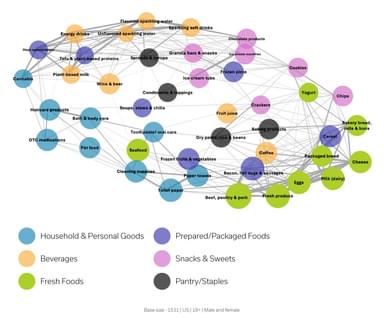
We looked at how product categories we tested mapped out on a bigger scale to see if there are any patterns and connections between them. Upsiide’s Idea Map revealed that some product categories had similar traits, and therefore performed similarly in the test. We combined those categories into 6 distinct groups:
Household & Personal Goods
Prepared/Packaged Foods
Beverages
Snacks & Sweets
Fresh Foods
Pantry/Staples
All categories are connected with lines. Connective lines indicate commonalities across categories; so consumers impacted by inflation in one category are also making changes in how they shop in those other categories with connective lines. The thicker the line, the stronger the relationship between those ideas, or in this case, product categories.
You’ll notice that ideas in the Fresh Foods group have the strongest connections. This means that people who had to change their shopping behaviour when buying, say, eggs, also had to change their behaviour when buying, for instance, milk (dairy) or cheese.
Brand or category managers might find this insight important because it means they need to keep an eye on shopping behaviors in related product categories (or categories that are related in the eyes of their target audience). For example, if a producer of eggs sees that there is less demand for milk or dairy, this change might impact them soon too.
2. Fresh foods are most frequently and most strongly affected by inflation, compared to other categories.
So which categories performed best in the face of inflation?
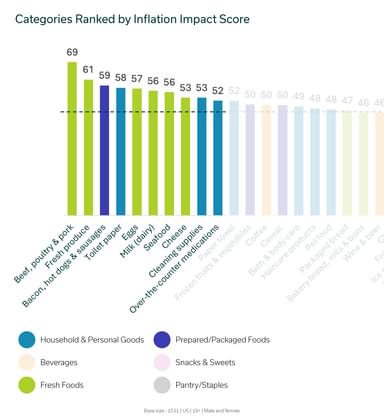
The top three categories include Beef, poultry & pork (Idea Score of 69), Fresh produce (61) and Bacon, hot dogs & sausages (59). 2 out of 3 are part of the Fresh Products group we mentioned above, suggesting that fresh goods are most impacted by inflation. This result isn’t a surprise, considering the soaring prices for products within this group.
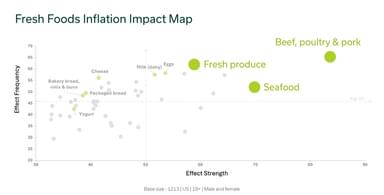
We put the ideas into a map that assesses the categories according to the Frequency and Strength of inflation’s effect on each product to illustrate the impact inflation has on purchase behavior in a multi-dimensional way. Frequency means how widespread the impact of inflation is, whereas Strength is how strongly people feel that impact.
Beef, poultry & pork appeared in the top right corner, along with Seafood and Fresh Produce, suggesting that inflation has both a widespread and strong effect on products in these categories.
3. While few Americans are feeling the impact of inflation on household and personal goods shopping, those that are impacted are feeling the effects very strongly.
As we continue diving deep into where categories stand by Frequency and Strength of inflation, we notice that products within the household & personal goods categories appear in 3 out of 4 quadrants.
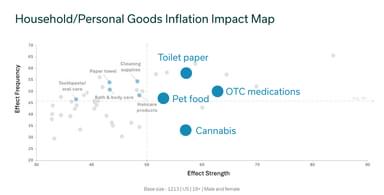
Toilet paper and OTC medications are in the top right quadrant along with Fresh Products. These products have been widely impacted by inflation and consumers may be finding it hard to afford or find these items in ways they hadn’t before. The pandemic has affected supply chains, meaning that materials for making these products are pretty stretched out.
While the cannabis and pet food categories are more niche, people who shop for these products are feeling the effect of inflation much more strongly than any other segment. In the last section, we’ll cover how shoppers have adapted to rising prices in these categories and the actions they have taken to save a buck or two.
4. Snacks, sweets & beverages are quite resilient in the face of inflation.
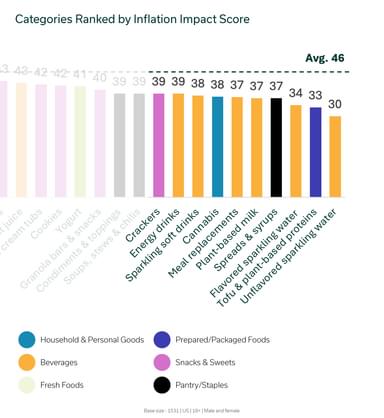
Unflavoured sparkling water (30), Crackers (39), and Granola bars & snacks (40) are some of the product categories that were least impacted by inflation (as of a few weeks ago when we ran the research). All of these categories performed below the average Idea Score of 46.
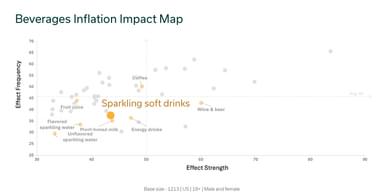
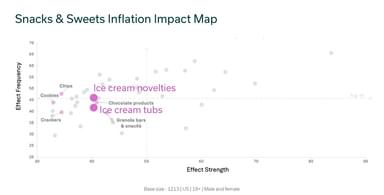
Looking at the Inflation Impact chart, we see that both beverage and sweets & snacks groups weren’t impacted much by inflation. It could be because these types of products aren’t essential or purchased as frequently as other products. Or perhaps products like flavoured sparkling water or ice cream are considered a treat, so people allow themselves to splurge a bit on these products. Either way, shoppers seem to be more willing to continue with ingrained habits instead of making accommodations and changing their shopping behavior in these categories.
5. People are employing many different tactics to save money right now.
What did people do in response to the inflation of grocery items? Our team analyzed the results by demographic and psychographic segment and outlined the results in the full report.
In this article, we’ll cover a few categories that we found the most interesting. But if you want to have a closer look at the results, download the reports now.
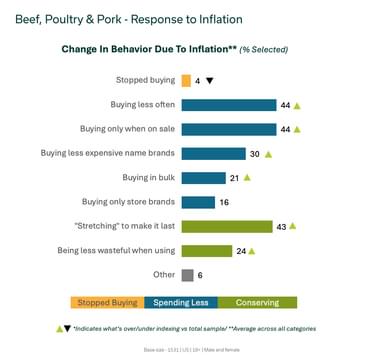
As mentioned, the beef, poultry and pork category is one of the most inflation-impacted categories. We asked consumers what they did to manage the rising prices of fresh meat and the majority simply decided to buy less of those protein products (44%) or buy only when on sale (44%). In comparison, only 4% cut out this category completely from their shopping lists. This means that instead of not buying animal protein, people found ways to spend less on them.
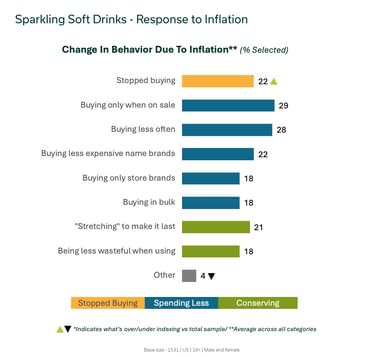
In contrast, people are rethinking their buying habits for sparkling soft drinks. This category disappeared from 22% of people’s grocery baskets due to inflation. Perhaps, besides being affected by rising prices, people also found an opportunity to reduce the amount of sugar they consume as they stopped buying sparkling soft drinks.
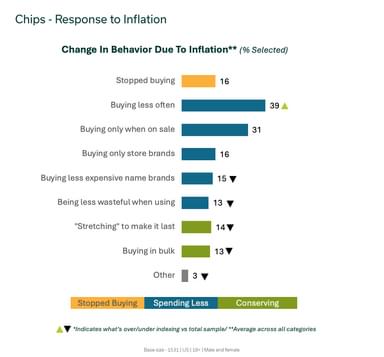
Interestingly, when we looked at which products people were trying to conserve, chips scored one of the lowest. Only 14% are “stretching” to make them last and 13% buy chips in bulk. Perhaps, this result proves our previous point that consumers aren’t adjusting their buying habits in the snacks category because they want a way of treating themselves. Not to mention, nobody likes stale chips.
Final thoughts
This is just the tip of the iceberg when it comes to what we discovered about the impact of inflation on Americans and Canadians. If you want to see how shopping behaviors changed in other categories in the US or check out everything we learned about inflation in Canada, be sure to grab a free copy of the reports.